Live discovery
Results appear as hosts are checked — no waiting for the sweep to
finish. Cancel any time; scans stay responsive on a full
/24.
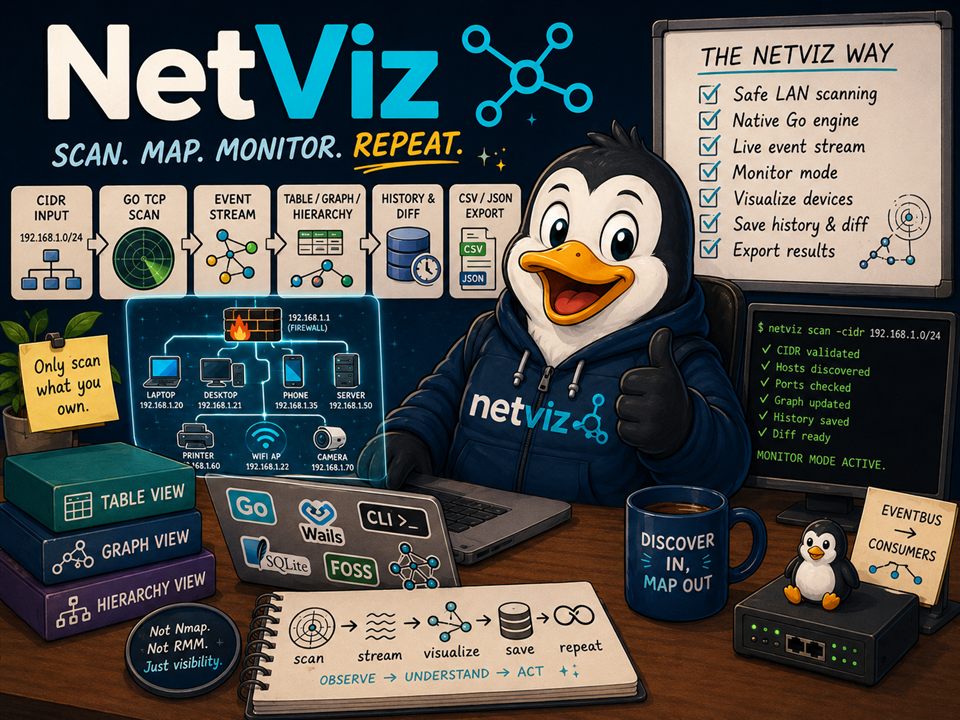
Scan. Map. Monitor. Repeat.
A free, open-source LAN scanner and network visualizer. Enter a CIDR, hit scan, and watch every device on your network stream in live — as a precise table, a grouped graph, and a clickable hierarchy map. Windows, macOS, and Linux.
No agents · no accounts · no Nmap · just run it.
Grab the build for your platform from the latest release. The desktop app is ready to run — no Go, Node, or build tools required.
netviz.exe at the top level
netviz-<version>-windows-amd64.zip
macOS
Extract and open netviz/netviz.app
netviz-<version>-darwin-arm64 / amd64.tar.gz
Linux
Extract and run ./netviz/netviz
netviz-<version>-linux-amd64.tar.gz
Early FOSS builds aren't code-signed yet. On first launch, Windows
SmartScreen (More info → Run anyway) or macOS Gatekeeper (right-click →
Open) may need a confirmation. Every archive also ships the
netviz-cli command-line scanner and a SHA-256 checksum.
NetViz validates your CIDR, runs a bounded native-Go TCP-connect scan of common LAN ports, enriches what it finds, and streams every observation into the views, exports, and history — all from the same live event stream.
Results appear as hosts are checked — no waiting for the sweep to
finish. Cancel any time; scans stay responsive on a full
/24.
Hostname resolution, MAC lookup from your ARP cache, and vendor names from an embedded snapshot of the full IEEE OUI registry — about 40,000 manufacturers — with a conservative device-type guess for every host.
Re-scans on an interval and flags every device so you can watch the network move:
new online offline changed stable
Click any device for a detail panel with IP, hostname, MAC, vendor, type, open ports — and its stored timeline: when it was up, what ports it exposed, and when that changed.
Save scans as versioned NetViz JSON and reopen them later, or export the table to CSV — straight from the File menu.
Completed scans land in a local SQLite database — monitor cycles with no changes are merged, so history records state changes, not noise. The History tab diffs the latest runs.
The app checks GitHub Releases, downloads on your say-so, verifies the SHA-256 checksum, and installs in place — keeping the previous version as a backup.
The same monitored /24 across every view — a precise
table, the grouped graph, the hierarchy map, and the history diff.
Click any snapshot for the full-size view.
The precise operational view: IP, hostname, MAC, vendor, alive
status, open ports, device type, first seen, and last updated.
Dead addresses are hidden by default — flip
Show checked-only to see every probe.
Devices grouped by inferred category — routers, printers, Windows/SMB, SSH hosts, web appliances — with open-port badges on every node.
A firewall/root node at the center with compact, clickable device
circles around it. Built to stay readable on dense
/24 scans.
Every saved run at a glance, plus a diff of the two most recent scans: which devices appeared, and which went missing.
NetViz performs bounded TCP-connect checks against a constrained, LAN-oriented default port set — enough to identify what a device is, without behaving like an aggressive scanner.
SSH HTTP / HTTPS SMB RDP VNC Printer (631 / 9100) RTSP MQTT Plex Alt web / admin
The same scan engine ships three ways: the desktop app, an always-on probe you drop at a site, and a self-hosted server that turns probe pushes into a live web dashboard.
netviz-probe installs as a Windows service, systemd
unit, or launchd job, scans on an interval, and pushes device
inventory with heartbeats — to AnchorDesk or your own NetViz
server, same wire contract.
The desktop Probe tab installs, configures, and manages the service — URL, key, CIDR, interval — through a shared config file the running service re-reads on every cycle.
One Docker container stores every push in SQLite and serves a
live dashboard: stat tiles, a full device table, and an
interactive canvas network map with zoom, pan, tooltips, and a
clickable legend. Try the map with /?demo.
Optional OIDC SSO (Entra ID, Google, Keycloak, Authentik) puts the web UI behind your identity provider. Probes authenticate with keys; ingest is deny-by-default until one is configured.
docker run -p 8080:8080 -e NETVIZ_INGEST_KEY=your-key \
  -v netviz-data:/data ghcr.io/spillers-technology/netviz

netviz-probe -url http://server:8080 -key your-key -cidr 192.168.1.0/24
Every release bundles netviz-cli, which shares the same
scan engine and local history store as the desktop app — scan,
save, list, and diff runs as JSON. Pipe it, script it, cron it.
netviz-cli scan -cidr 192.168.1.0/24
netviz-cli scan -cidr 192.168.1.0/24 -save
netviz-cli history
netviz-cli diff
One rule: ScanEngine → EventBus → Consumers. The scanner
core has no dependency on the UI, server, or storage — every view,
export, and history record consumes the same typed event stream.
MIT licensed, written in Go with a Wails desktop shell. The history store uses a pure-Go SQLite driver, so there's no CGO anywhere in the build. Read the code, file an issue, or send a PR — the whole scanner fits in your head.
netviz-probe headless scanner with AnchorDesk device push, heartbeats, and native service management.